Community Management Metrics: How to Measure What's Actually Working
Response rate and comment volume don't tell you if community management is working. Here are the metrics that do.

Marcie Swan
//
Community Manager

We already made the case for why community management deserves a real budget line. This is the follow-up nobody asks for until the CFO does: how do you actually measure it?
The easy answer is with response rate, response time, and comment volume. Those numbers are quick to pull, and they look tidy in a slide deck, but they tell you almost nothing about whether community management is doing its job. A team can hit a 95% response rate, reply within twenty minutes every time, and generate hundreds of comments a month while their share of category conversation shrinks, their AI visibility stays at zero, and churn creeps up. The dashboard says green; the business doesn't feel it.
The problem isn't that those metrics are wrong, per se; they do measure effort. They just get treated as if they measure outcomes, however, and a CEO who glances at a dashboard for 30 seconds a week may not be able to tell the difference. So what do we need to look at instead, and how do you get it in front of leadership without losing the room?
Sentiment trend, not sentiment snapshot
What it is. The direction your brand's public sentiment is moving across the comments, mentions, and threads where people talk about you, tracked over time rather than checked once.
How to calculate it. Run every public comment, mention, and review from the period (weekly minimum) and through a sentiment classifier. You can use either a social listening tool's built-in scoring (Sprout, Brandwatch, Meltwater) or a lightweight LLM-based classification pass if you're tagging manually. Score each item positive, neutral, or negative, then calculate a net sentiment score: (% positive − % negative). Plot that number weekly on a rolling line, not a single-period bar.
What good looks like. There's no universal target, because sentiment baselines differ by category and how much criticism your product invites by nature. You want to focus on the trend line. A net sentiment score holding steady or climbing over eight to twelve weeks is healthy. If you have a score that's drifting down for three straight weeks, even if it's still net positive, that is an early warning that something in your product, support, or messaging is generating friction faster than community management can absorb it.
Why it’s more than just response rate. Response rate tells you someone showed up. Sentiment trend tells you whether showing up is working. If you have a perfect response rate to frustrated consumers the response rate number will never flag it. Sentiment trend can tell you when and where the shift is happening while it’s still small enough to fix before you need a crisis plan.
Share of conversation in your category
What it is. The percentage of total public conversation about your category that mentions your brand specifically, compared to your named competitors. Marketers usually call this share of voice; "share of conversation" is the more honest term for what it captures in organic, unpaid discussion.
How to calculate it. Here's the math: count your brand mentions, then count total mentions across your brand plus your competitor set, over the same window and the same channels (LinkedIn, Reddit, review sites). Divide the first number by the second, multiply by 100, and that's your share of conversation. Most listening platforms will do this for you automatically once you've set up brand and competitor tracking. No tool yet? A monthly Boolean search count across those same sources gets you close enough.
What good looks like. Again, no fixed number, since it depends on how many competitors you're splitting the conversation with. You want to watch whether your share sits above your actual market share (a state marketers call excess share of voice) and whether it's trending up. A brand with 15% market share but 8% share of conversation is invisible relative to its size. A brand with 15% market share and 22% share of conversation is punching above its weight.
Why this matters more than comment volume. Comment volume measures activity on your own posts. Share of conversation measures whether you exist in the conversation outside of that. A brand can generate strong comment counts on its own LinkedIn page while a competitor owns every relevant Reddit thread.
Comment depth and reply velocity as LinkedIn distribution signals
This is the metric most teams think they're already tracking when they count comments. Volume and depth aren't the same thing, and only one of them moves LinkedIn's algorithm.
What it is. The average number of back-and-forth exchanges per comment thread (not just top-level comments), and how quickly your team replies to the first comment on a new post.
How to calculate it. For depth: total replies within threads ÷ total top-level comments, averaged across your posts for the week. A post with ten top-level comments and zero replies scores 0. The same post with ten top-level comments and fifteen threaded replies scores 1.5. For velocity: time from post publish to first team reply, averaged across the week's posts.
What good looks like. Aim for a thread depth score above 1.0, meaning your comment sections are generating real back-and-forth, not just drive-by reactions. For velocity, reply within the first two hours consistently; that window is where LinkedIn's engagement weighting does the most work, and it's also the window where a live thread has the best chance of pulling in more commenters.
Why comment depth and velocity tell you more than comment volume. LinkedIn's ranking system weighs threaded conversation and dwell time far more heavily than raw comment counts, and it can tell the difference between a lively thread and fifty unrelated one-liners. A post with forty flat comments and a post with fifteen comments that turned into real conversations will not get the same distribution, even though the first one looks better on a volume report.
GEO visibility: are AI engines naming you at all?
What it is. Whether AI answer engines (ChatGPT, Claude, Google AI Overviews, Gemini) name your brand when a prospective buyer asks a category question, and how consistently.
How to calculate it. Build a set of 15 to 25 prompts your ideal customer would likely type ("best [category] for a mid-size manufacturer," "[competitor] vs alternatives," "is [your brand] worth it"). Run them monthly across the major engines, log whether your brand appears, in what position, and what source the engine cites when it does. Track it as a simple appearance rate: (prompts where you're named ÷ total prompts tested) × 100. Learn about our tool, Lighthouse, that checks how AI engines describe you, scores your pages, and gives you the fixes to help increase AI mentions.
What good looks like. Appearance rate climbing month over month matters more than any single number, since most brands are starting near zero. You want to watch the source column closely and see if engines are consistently citing a specific forum thread, review page, or comparison post. That tells you where to put more community effort next month.
What it tells you that any standard metric doesn't. None of the traditional three metrics touch this at all. AI engines build answers from discussion they trust, weighted heavily toward Reddit, forums, and review sites, and a brand with a strong response rate on its own LinkedIn page can still be functionally invisible to a buyer asking ChatGPT for a recommendation. This is the metric that catches a discoverability gap.
A note on FAQ schema, since it comes up in every GEO conversation right now: Google pulled FAQ rich results from Search in May 2026, and its own generative AI guidance says no special schema is required to show up in AI Overviews or AI Mode. FAQPage markup doesn't buy you a ranking boost anymore. It's still worth adding to a page with genuine Q&A content, because it helps AI parsers on platforms like Bing and Perplexity extract clean answer pairs, and it costs nothing to include. What actually earns citation is the visible content underneath it: real questions, direct answers, written by someone who knows the answer instead of padding it for length.
Connecting community activity to pipeline and retention
This is the part that most people skip, but it’s possibly the most vital piece to leadership.
What it is. A direct or credibly correlated link between community engagement and two business outcomes: pipeline movement and account retention.
How to calculate it, pipeline side. Start by marking in your CRM any deal where the community showed up somewhere in the journey. That could be a link you shared in a comment reply that someone clicked, a contact who was active in a community thread before they booked a call, or a case where a salesperson remembers a prospect bringing up something they saw in a public exchange. Once a month, pull all the deals with one of those touches and compare two things against deals with no community touch at all: how often they close, and how long they take to close. One deal doesn't prove anything on its own. But once you're looking at enough of them, a pattern shows up that's hard to argue with.
How to calculate it, retention side. Split your current accounts into two groups: ones that have engaged with your posts, threads, or support content in the last quarter, and ones that haven't. Every or every other quarter, check each group's churn rate and renewal rate. If the community-active group is renewing at a noticeably higher rate, that's the number you bring to the CEO.
What good looks like. If you start seeing any community-touched deals closing faster, community-active accounts renewing at a higher rate, or any consistent, positive gap. The gap doesn't need to be enormous to be worth reporting. A five-point difference in renewal rate between the two groups, tracked quarterly, is a real number tied to real revenue, which is more than a comment-volume chart will ever give you.
The dashboard: what goes in it, where the numbers come from, and how often to pull them
A lot of this will be pulled weekly. However, report the pipeline and retention numbers monthly, since they don't move fast enough to justify a weekly slide and reporting them too often invites noise.
Net sentiment score (weekly). Source: social listening tool sentiment scoring, or manual classification of the week's comments and mentions.
Share of conversation (weekly, trended monthly). Source: social listening platform's brand-vs-competitor mention tracking.
Comment thread depth and reply velocity (weekly). Source: native platform analytics (LinkedIn, Instagram, etc.) pulled manually or through a scheduling tool's engagement export.
GEO appearance rate (monthly). Source: manual prompt testing across ChatGPT, Perplexity, and Google AI Overviews, or an AI visibility tracking tool once volume justifies one.
Pipeline correlation (monthly). Source: CRM pull, tagged community touches vs. untagged, compared on close rate and cycle length.
Retention correlation (quarterly). Source: CRM/CS platform, community-active vs. community-inactive account cohorts, compared on churn and renewal rate.
Keep response rate, response time, and comment volume in the dashboard too, just demoted to context rather than headlines. They still answer a real question: is the team keeping up with volume? They just don't answer whether keeping up is working.
Reporting up to a CEO who has never thought about share of conversation
Now you are walking into the boardroom with your CEO who has never thought of the phrase thread depth score but wants some facts, stat! Don’t give her the platform language; she doesn’t need to know that. She needs to know three things: is our public reputation moving in the right direction, are we visible where our buyers are actually looking (including inside AI answers now), and does any of this connect to revenue?
Translate accordingly. Use phrases you would use to describe it to your spouse over dinner rather than someone who is in the nitty-gritty everyday. Sentiment trend becomes "here's whether the market's opinion of us is improving or slipping." Share of conversation becomes "here's how much of the category conversation we own versus [named competitor]." GEO appearance rate becomes "here's whether ChatGPT and Perplexity recommend us when a buyer asks, and whether that's getting better." Pipeline and retention correlation becomes, plainly, "here's the dollar signal." One slide, one chart per number, trend lines instead of single data points, and a one-line takeaway above each chart instead of raw platform screenshots.
Example dashboard layout
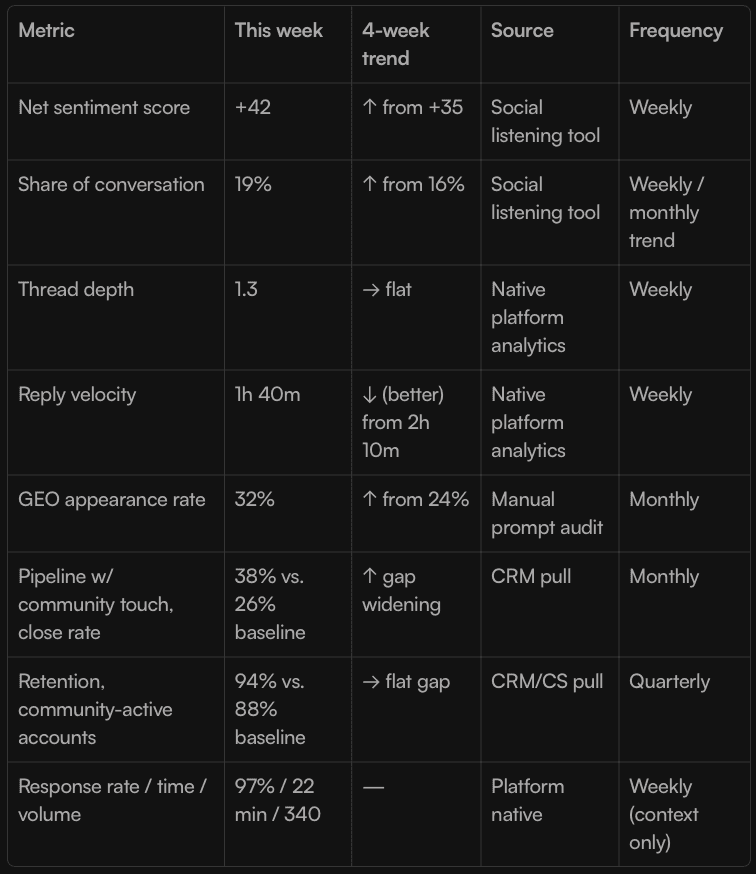
That's a dashboard a CEO can read in ninety seconds and actually retain.
FAQ
What's wrong with response rate and response time as community management metrics? Nothing, as far as they go. They measure whether the team is keeping up with volume, which matters operationally. They don't measure whether the engagement is changing sentiment, winning share of conversation, feeding algorithmic reach, building AI visibility, or moving pipeline and retention, which are the things that determine whether community management is actually working.
How often should we measure share of conversation? Pull the raw number weekly if your listening tool supports it, but judge it on a monthly trend. Week-to-week swings are usually noise from a single viral post or a competitor's campaign spike. The direction over four to eight weeks is the signal.
Do we need an enterprise social listening tool to track these metrics? Not to start. Sentiment and share of conversation can be tracked manually with Boolean search counts and spot classification for a while. The volume of a mid-market brand's mentions usually doesn't justify an enterprise platform until you're tracking multiple competitors across multiple channels every week.
Should FAQ schema still be on our pages in 2026? Yes, if the page has genuine question-and-answer content, but for a different reason than it used to matter. Google removed FAQ rich results from Search in May 2026 and has said no special schema is required for AI Overviews. FAQPage markup won't win you a search feature anymore, but it costs nothing, and it helps AI parsers on platforms outside Google extract clean answer pairs from a page that already has strong content.
How long before we see the pipeline and retention numbers move? Give it two full quarters before drawing conclusions. Sentiment and share of conversation can shift within weeks. Pipeline correlation needs enough deals to move through the funnel to be statistically meaningful, and retention needs at least one renewal cycle. Reporting these too early, before there's enough data, is how a genuinely working program gets killed for looking flat.
More blogs.
Explore our collection of insights — from quick, actionable tips to in-depth explorations of design, development, and the evolving world of digital work.