TikTok Benchmarks 2026: What CPG Brands Should Measure Against
TikTok engagement, view, and watch time benchmarks for mid-market CPG brands, broken out by follower tier.

Brandon Kim
//
Senior Data Analyst

Ask three social platforms what counts as a good TikTok engagement rate in 2026, and you'll get three different numbers, none of which will match what you're seeing in your own dashboard. Part of that is formula: some benchmarks divide by followers, some by views, some by reach, and most reports don't say which. But the bigger problem for CPG brand managers specifically is that almost every published TikTok benchmark treats a 15,000-follower snack brand the same as a 2-million-follower creator account, then wonders why the "average" doesn't mean anything.
Account size changes what a good number looks like. So does content type. A CPG account posting three times a week is playing a different game than a creator posting daily, and most benchmark reports blend both into one figure. Before you compare your TikTok numbers to anything in this post, know what's being measured and who's actually in the sample.
This post breaks out four metrics that matter for a mid-market CPG brand tracking TikTok performance: engagement rate, views, follower growth rate, and average watch time. Each is split by follower tier, because a 12,000-follower account and a 400,000-follower account are not solving the same problem.
What's a Good TikTok Engagement Rate for a CPG Brand in 2026?
It depends entirely on your follower count, and the gap between tiers is bigger on TikTok than on almost any other platform.
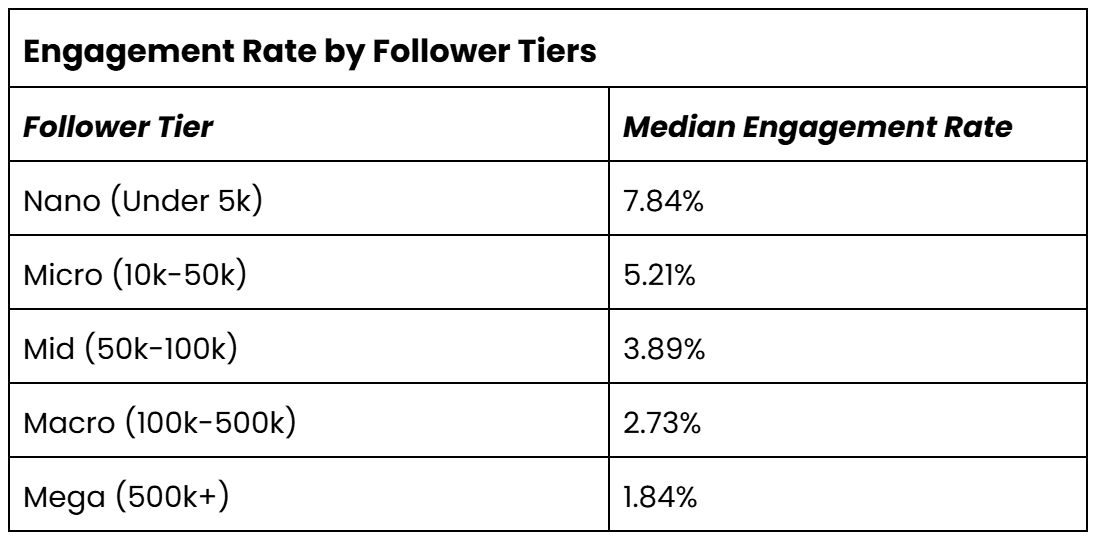
Engagement Rate by Follower Tiers
Nano (Under 5k) - 7.84%
Micro (10k-50k) - 5.21%
Mid (50k-100k) - 3.89%
Macro (100k-500k) - 2.73%
Mega (500k+) - 1.84%
Data Source: SociaVault — "What Is a Good Engagement Rate on TikTok in 2026? (Based on 150,000 Accounts)"
A nano account and a mega account are not playing the same game. TikTok's algorithm pushes small accounts to non-followers far more aggressively than it does large ones, which is why engagement rate drops by more than 4 points between the smallest and largest tiers. If your brand sits in the 50K-100K range, benchmark against 3.89%, not against the flattering nano numbers or the discouraging mega ones.
One formula note before you compare these to your own dashboard: this table measures engagement against follower count. Some platforms report engagement against views instead, which produces a different, usually lower, number for the same account. Check which denominator your own tool uses before you line these up against your data.
What Are Good TikTok Views for a CPG Brand by Account Size?
Raw view counts mean little without your follower count attached, so the number that actually matters is views as a share of your followers.
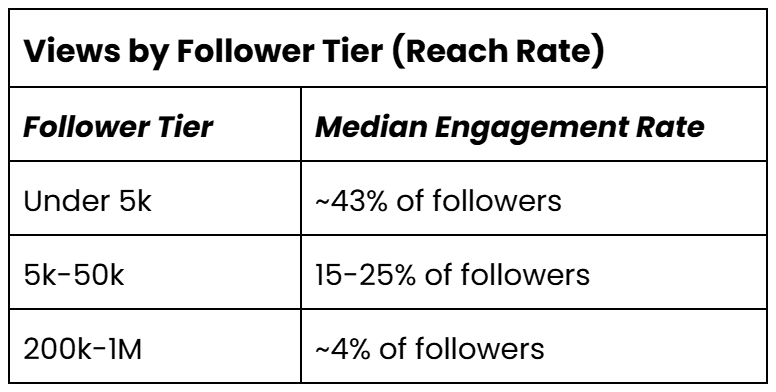
Views by Follower Tier (Reach Rate)
Under 5k: ~43% of followers
5k-50k: 15-25% of followers
200k-1M: ~4% of followers
Data Source: AdManage.ai — "Average TikTok Views in 2026: Real Benchmarks by Follower Count"
Smaller accounts see a bigger slice of their own audience on every post. A 3,000-follower account might expect around 1,300 views on a typical video. A 500,000-follower account might see only 20,000, a fraction of a percent of what a nano account gets proportionally, even though the raw number looks larger. This is TikTok's For You Page at work: reach isn't rationed by follower count the way it is on Instagram or Facebook, so a big account has to keep earning its distribution on every single post.
How Fast Should a CPG Brand Be Growing Its TikTok Following?
Growth compounds down as an account scales, and that curve has gotten steeper industry-wide.

Follower Growth Rate by Tier
Nano (1k-5k): ~150% annual growth rate
Macro/Mega (100k-1M): ~30% annual growth rate
Data Source: IQFluence, citing Socialinsider's 2026 data — "Social Media Benchmarks 2026 by Industry & Platform"
Both ends of the spectrum are growing slower than they were a year ago. Nano accounts dropped from roughly 269% annual growth down to 150%, and the largest accounts slipped from 33% to 30%. Smaller accounts still compound faster in percentage terms since it takes far fewer new followers to move the needle, but the platform-wide slowdown means a brand that grew fast in 2024 shouldn't expect the same pace without a change in strategy.
Why We Aren't Publishing a Watch Time Benchmark Table by Tier
Every other metric in this post breaks cleanly by follower count. Watch time doesn't, and that's worth explaining rather than forcing a table that would misrepresent what's actually driving the number.
Average watch time depends on video length far more than it depends on account size. A 15-second video and a 90-second video are not comparable on this metric even if they came from the same brand on the same day, and TikTok's own algorithm now weighs total watch time over completion percentage, which means a longer video held for 40% of its runtime can outperform a short video watched in full.
Follower count barely enters into that equation. A 12,000-follower account and a 400,000-follower account posting the same 20-second format will land in a similar watch time range, while two accounts of identical size posting at different lengths will not. That's a fundamentally different relationship than engagement rate or views, both of which shift in a fairly predictable direction as follower count grows.
Publishing a tier-based watch time table would suggest that account size is the variable driving the number, and it isn't. What we found instead was watch time broken out by video length: a 15 to 30 second video typically holds 50 to 60% of viewers through, a 30 to 60 second video holds 40 to 50%, and anything past a minute drops to 30 to 40%.
If you want to know whether your own watch time is healthy, the useful comparison is against your own videos of a similar length, not against a follower-tier average that doesn't isolate the right variable. Pull your last 15 to 20 posts, group them by runtime, and check retention within each group. That comparison will tell you far more than any published benchmark, because it controls for the one factor that actually explains the number.
The Number That Matters Is the One Tied to Your Tier
Every table in this post says the same thing in a different way: TikTok doesn't have one good number; it has five, and the right one depends on where your account actually sits. A nano account chasing a mega account's engagement rate is aiming at the wrong target, and a macro account panicking over a number that would be strong at their size is doing the same thing in reverse.
That Random Agency built these tiers because a mid-market CPG brand comparing itself to platform-wide TikTok averages is comparing itself to influencer accounts, entertainment creators, and mega-brands with entirely different content strategies. None of that is your competition. Your competition is the account next to you in your own tier, and that's the number worth tracking every quarter.
Need help turning your own numbers into a real benchmark? Chat with our team today!
FAQs on TikTok Benchmarks for CPG Brands in 2026
Why do TikTok engagement rates look so much higher than Instagram's?
TikTok's algorithm pushes content to non-followers far more aggressively than Instagram does, so a post's audience isn't limited to people who already follow the account. That inflates engagement rate relative to a platform where reach is mostly capped at your existing following. A 3% engagement rate that would be strong on Instagram is below average on TikTok.
My account doesn't fit neatly into one of these follower tiers. Which benchmark should I use?
Use whichever tier your follower count falls into at the time you're measuring, not where you expect to be in six months. Benchmarks tied to follower count shift as an account grows, so a brand near a tier boundary should expect its target number to move too.
Should I compare my TikTok numbers directly to my Instagram numbers?
No. Different platforms, different formulas, different audience behavior. TikTok's algorithm-driven distribution and Instagram's follower-based reach produce numbers that aren't built the same way, so a side-by-side comparison will mislead you more than it helps. Benchmark each platform against its own tier data.
Why isn't there a watch time benchmark table like the other three metrics?
Because watch time is driven by video length, not follower count, and a tier-based table would imply a relationship that isn't there. A 20-second video from a 10,000-follower account and a 20-second video from a 400,000-follower account land in a similar watch time range, while two videos of different lengths from the same account won't. Compare your own watch time within groups of similar-length videos instead.
How often should I check these benchmarks against my own account?
Quarterly, at minimum. TikTok's engagement rates and growth rates have both trended downward industry-wide over the past two years, so a benchmark from a year ago is already out of date. Recheck your tier's numbers each time you review performance, not just once when you first set your targets.
More blogs.
Explore our collection of insights — from quick, actionable tips to in-depth explorations of design, development, and the evolving world of digital work.