Instagram Benchmarks 2026: What Mid-Market Brands Need to Know
Here are the Instagram benchmarks in 2026 mid-market brands should actually be measuring against.

Brandon Kim
//
Senior Data Analyst

Instagram Benchmarks 2026: What Mid-Market Brands Need to Know
Ask five analytics platforms what a good Instagram engagement rate looks like in 2026, and you'll get five different answers. That's not because anyone's making numbers up. It's because "engagement rate" has at least three different formulas in circulation, and most reports don't say which one they used before publishing the headline stat.
So before we dive into the benchmarks, a quick note on what you're actually looking at:
Engagement rate by followers (ERF) divides total interactions by your follower count — this produces small numbers because most followers never see any single post. Engagement rate by reach (ERR) divides by the number of accounts that actually saw the post, which produces bigger, flashier numbers. When you see wildly different "Instagram averages" quoted across articles, this is usually why.
Engagement Rate by Followers (by Format)
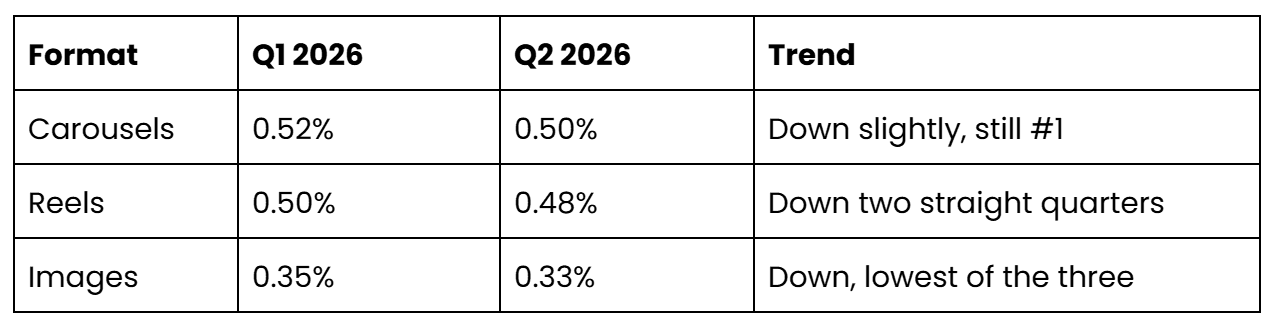
Carousels: 0.52% Q1 2026, 0.50% Q2 2026, down slightly but still #1 format
Reels: 0.50% Q1 2026, 0.48% Q2 2026, down two straight quarters
Images: 0.35% Q1 2026, 0.33% Q2 2026, down and lowest of the three formats
Sources: Socialinsider Instagram Benchmarks 2026
Carousels have held the top spot over Reels for several quarters now, which runs against the "just post more video" advice that was standard through 2023–2024. Reels still win on raw reach, especially under 50K followers. Carousels win on engagement once someone's actually looking at the post, as Instagram re-serves carousels to people who didn't swipe through the first time, something single images and most Reels don't get.
None of these numbers mean much without one more variable: how big your account already is. A carousel at 0.50% engagement is unremarkable for a 5,000-follower page and outstanding for a 500,000-follower one. That’s the next table.
Engagement Rate by Account Size
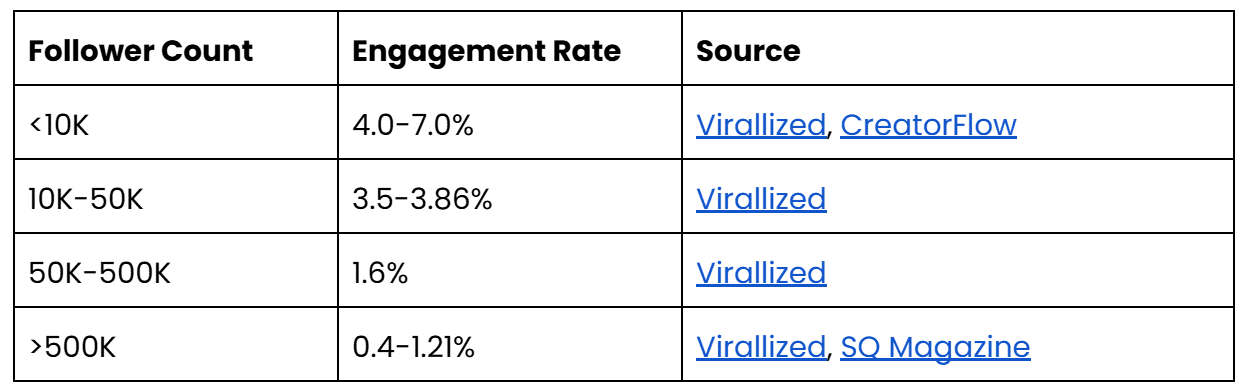
<10k followers: 4-7% engagement rate
10k-50k followers: 3.5-3.86% engagement rate
50k-500k followers: 1.6% engagement rate
>500k followers: 0.4-1.21% engagement rate
Sources:
This is the single most useful table in this post, and also the one people misuse most. Take a 1.5% engagement rate: mediocre for an 8,000-follower account, well above average for one sitting at 400,000. If your team is reporting engagement rate to leadership without naming the account-size tier it's being measured against, the number is close to meaningless.
Reach Benchmarks
Reach is where the format story gets more complicated than "video wins." Reels drive reach best for accounts under 50K followers. Past that threshold, carousels take over as the stronger reach driver — a reversal of the conventional "post more video" advice that dominated 2023–2024 (Socialinsider). Reels between 30 and 60 seconds outperform shorter or longer cuts on reach specifically, with reach dropping steadily as video length increases past that window.
By formula, reach-based engagement rate estimates for Instagram range from 1.9% to 3.5% across current reports, according to Apaya's side-by-side comparison of four major 2026 benchmark studies — Hootsuite's own numbers alone have moved between 3% and 3.5% across two articles published two weeks apart. Same lesson as the format table: check which denominator a report used before you compare it to your own numbers.
Follower Growth Rate
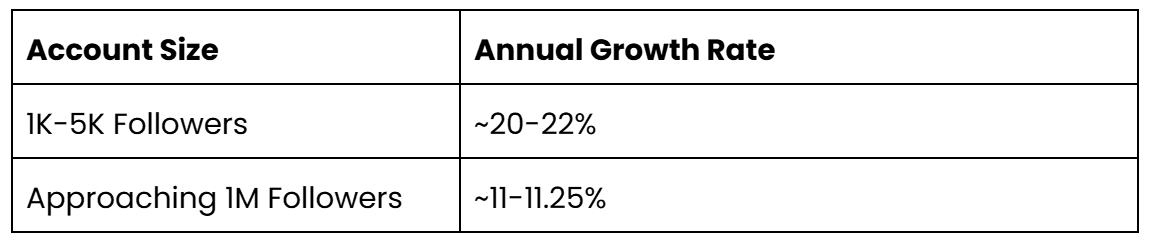
1k-5k followers: 20-22% annual growth rate
Approaching 1 million followers: 11-11.25% annual growth rate
Source: Socialinsider via IQFluence
For a weekly read instead of annual, 1%–2% net new followers per week is considered solid for accounts under 100K (CreatorFlow). Growth compounds down as accounts scale, mostly because retention and churn start canceling each other out rather than any drop-off in content quality.
FAQs on Instagram Benchmarks in 2026
Why do different reports give me different "average engagement rate" numbers for Instagram?
Because they're not all measuring the same thing. Some divide by followers, some by reach or views, and a few blend both without saying so. The four-source comparison in this post alone shows reach-based estimates ranging from 1.9% to 3.5% — and that's before you even get into follower-based math, which runs far lower.
Should I aim for the highest number I can find?
No. Aim for consistency in how you measure, month over month, so your own trend line means something. Comparing your by-reach number this quarter to a by-follower number from a different report will only produce false confidence or a false alarm.
All three formats in the table dropped from Q1 to Q2 — does that mean my content is underperforming?
Not on its own. Carousels, Reels, and images all declined at the same time, which points to a platform-wide shift rather than anything specific to one account. Check whether your own rate fell faster or slower than the format average before assuming your content lost its edge.
Should I be optimizing for reach or engagement on Reels?
Depends on your account size. Under 50K followers, Reels are still your strongest reach driver — use them to get found. Past that threshold, carousels take over on reach, and they've already been leading on engagement at every size. Match the format to the goal instead of defaulting to whichever one used to work.
My follower growth rate looks slower than it did last year — should I worry?
Probably not by itself. Growth rate compounds down as an account gets bigger; a page at 5K and a page near 1M are never going to post the same percentage, even with equally strong content. Compare your growth rate against your own tier's benchmark, not against your account's earlier, smaller-audience numbers.
The Benchmark That Actually Matters Is Yours
Every number in this post comes from a real 2026 report, and reading past the headline stat gets you to the same place every time: use these as a starting compass, not a scoreboard. Socialinsider's own quarterly data shows carousels, Reels, and images all moving together — the ranking holds, but the exact percentage shifts every few months. Apaya's comparison of four benchmark studies put reach-based engagement anywhere from 1.9% to 3.5%, and even Hootsuite couldn't agree with itself across two articles two weeks apart. That's not sloppy reporting. That's just how many different formulas are currently being called the same name.
None of that noise should change what you actually do with these numbers. Your audience isn't the audience in someone else's sample set, and the account-size table only tells you what's typical for accounts your size — not what's possible for yours specifically. Use the tables in this post to sanity-check whether you're in the right range for your tier. Then build your real target from your own last two, four, and twelve months of data, measured the same way every time.
Need help turning your own numbers into a real benchmark? Chat with our team today!
More blogs.
Explore our collection of insights — from quick, actionable tips to in-depth explorations of design, development, and the evolving world of digital work.